IMPORTANT: Files are not stored in a server, all loaded files are kept safe and confidential by being handled solely by the browser.
TreeLink Manual
Treelink links phylogenetic trees in newick format to datasets (csv) and sequence files (fasta). The integration is done with the use of the leaf identifier as the index for the other data sources, which can be then displayed and extracted from the phylogenetic tree.
Data input
Treelink takes as an input Newick format trees, Csv datasets and fasta sequence files. To load a file it is necessary to browse and select the file from a local disk under the right form. For the data integration to be successful, the identifier for the leafs, the csv data and the fasta file
need to match.
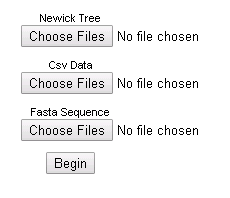
Example files to load for the tool can be found here:
Set 1:
Example tree 1
Example csv 1
Example fasta 1
Set 2:
Example tree 2
Example csv 2
Example fasta 2
Set 3:
Example tree 3
Example csv 3
Example fasta 3
It is recommended to select short names (1-20 characters) for leaf identifiers and avoid the use of special characters to avoid any parsing errors. In case the tool cannot display a tree it is best to shorten the name of the identifier and/or remove any special charaters of the leaf.
Linking the data:
The Key is going to link the tree to the csv, so the values need to match. The rows will link the tree to the fields of the csv selected by the user. After the integration step, the associated data can be seen by hovering over a leaf in the tree.
IMPORTANT: If you want to make the leaf names searchable, select them twice, as the Key and as a row.
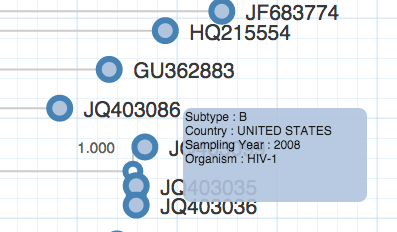
You can see the linked attributes by hovering over a leaf.
Functions
All the main functions are directly accessible in the button panel at the right in the application.
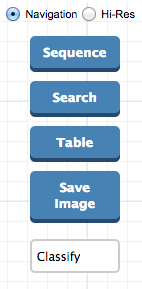
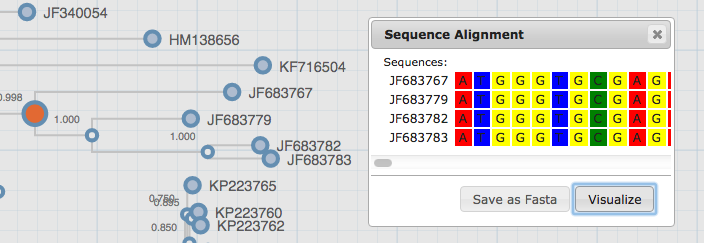
Sequence: After selecting a number of leafs or an internal node, sequences can be visualized or extracted. This function may take some time depending on the amount of sequences selected, the size of the file and the length of the sequence. If a node fails to be selected, try zooming in on it a bit more and then selecting it.
Search: A direct search of up to four different attribute values can be searched for the leafs, resulting in an annotated visualization of the tree.

Table: This button displays the table loaded from the csv file. You can click on attributes to search them on the tree.

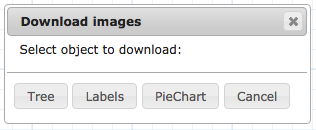
Save image: This button allows to save the current visualization in svg format. The objects that can be downloaded are the Tree, the labels and the Piechart.
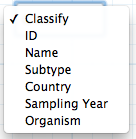
Classify: This dropdown list annotates the tree for a field in the dataset. The field had to be already selected in the data integration step in order to be shown. It only works on categorical data.
The layout of the tree can be modified by switching between the Navigation/Hi-res radio button. The Hi-res visualization switches to a layout with the full tree on high resolution.

The buttons at the bottom allow to subset the tree by selecting an internal node, or to clean the visualization from any annotations.

TreeClus Manual
In simple terms TreeClus uses branchlengths of phylogenies to define the most significant clusters of phylogenetic trees. It stores and orders evolutionary distances (branchlengths) to find differential patterns in their distribution. Then it displays those significant changes in a graph, along with the accumulated dissimilarity they represent. Those differential patterns can then be selected to cut the tree into the most significant subsets (subtrees) to define clusters. This document explains in more detail how the algorithm works.
Data input
The online version of TreeClus takes as a sole input Newick format trees. Csv datasets and fasta sequence files can be integrated in the Desktop version. To load a file it is necesarry to browse and select the file from a local disk and upload it in the form.

Example files to load for the tool can be found here:
Example tree 1
Example tree 2
Example tree 3
It is recommended to select short names (1-20 characters) for leaf identifiers and avoid the use of special characters to avoid any parsing errors. In case the tool cannot display a tree it is best to shorten the name of the identifier and/or remove any special charaters of the leaf.
Functions
All the main functions are directly accessible in the button panel at the right in the application. At the top, information on the cut value and number of clusters is displayed.
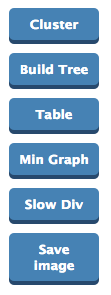
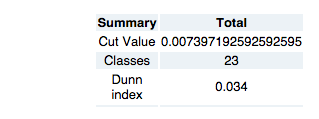
Cluster: After Selecting a dot from the blue line in the graph, this button clusters the tree again with the new cut value. When selecting the value, take into account the shifts in branchlength value (the blue line). The tool will suggest some points, (red points along the line) but manual selection is adviced.

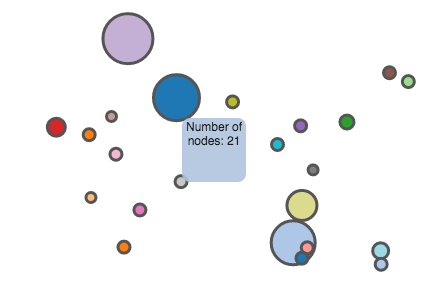 Hovering over a point in the graph will show the number of cuts to the tree made for that point and also the ammount of dissimilarity explained by that value.
Build Tree: This button constructs and visualizes the tree based on the clusters calculated.
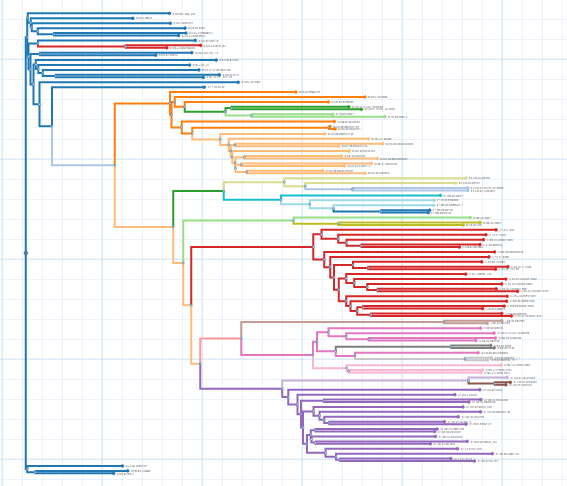
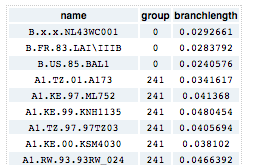
Table: This button displays the table with the cluster identifiers.
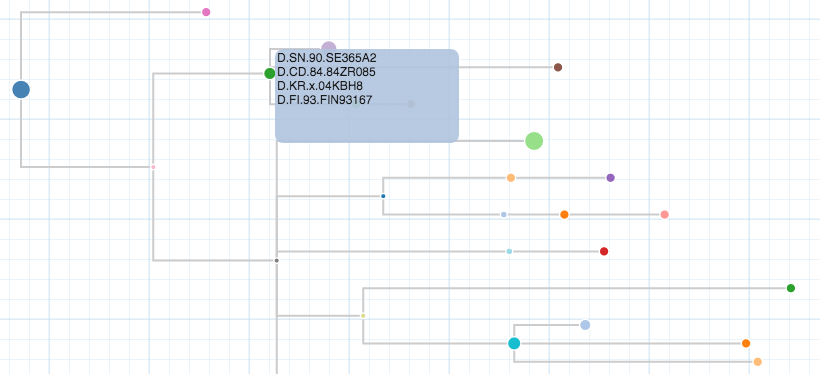
Min graph: This button creates a minimized visualization of the tree. Large trees can be simplified with this function, for a better representation. Hover over a node to get the sequence identifiers of that cluster.
Change Alg: A switch button that changes the clustering algorithm from Slow/High Divergence. The topology of the tree, and the purpose of the clustering should be taken into account when selecting a given divergence for the algorithm, as they will output different results. The tool will detect and suggest the initial algorithm when loading a tree.
Save image: Save function for the current viualization.
TreeMap Manual
In simple terms, Treemap reconstructs ancestral states (countries in this case) for the internal nodes of the tree by using data provided in the csv file for the leafs. The reconstruction is achieved with parsimony (Swofford et al.) and likelihood (Lewis et al.) algorithms. Then the "spread" or contact of states of the tree can be plotted on a map by converting the phylogenetic structure into an object that contains all the changes of states in a time (or evolutionary) scale.
Note: The ancestral reconstruction function can be used on alternative attributes (other than country), for example morphological and viral traits, events, etc.
Data input
The online version of Treemap takes as an input a Newick format tree and a Csv containing an identifier and the country.
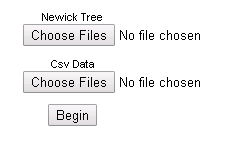
An additional selection has to be made on the format of the Country field. Valid country formats and names can be found on this document.
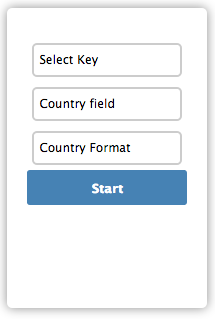
Name: Full name of the country. Ex: SPAIN, GERMANY, CHILE etc.
2-letter Code: 2 letter code of the country. Ex: ES, DE, CL etc.
3-letter Code: 3 letter code of the country. Ex: ESP, DEU, CHL etc.
Example files to load for the tool can be found here:
Set 1:
Example tree 1
Example csv 1
Set 2:
Example tree 2
Example csv 2
Set 2:
Example tree 2
Example csv 2
It is recommended to select short names (1-20 characters) for leaf identifiers and avoid the use of special characters to avoid any parsing errors. In case the tool cannot display a tree it is best to shorten the name of the identifier and/or remove any special charaters of the leaf.
Functions
Initially, Treemap will perform a basic reconstruction based on simple parsimony (No transformation rules). Then, the reconstruction method can be changed to another one. All the main functions are directly accessible in the button panel at the right in the application.
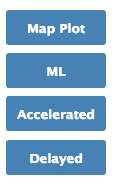
Accelerated: Parsimony reconstruction with an accelerated transformation rule. In case a reconstruction remains ambiguous by linear parsimony, an accelerated rule will choose reversals over parallelisms.

Delayed: Parsimony reconstruction with a delayed transformation rule. In case a reconstruction remains ambiguous by linear parsimony, a delayed rule will choose parallelisms over reversals.

ML: Maximum Likelihhod reconstruction. This method is best used under the assumption of Brownian motion, as it includes branch lengths into the analysis.

After the reconstruction is done, values for ancestral state reconstruction uncertainty can be seen by hovering over a node.
P: represents an uncertainty value for Parsimony reconstruction
Ltest: estimates the significance of the ML reconstruction. Values below 0.6 can be interpreted as adequate for a reconstruction.
Both estimates can be compared on a state to decide on a method.
Map Plot: After performing ancestral reconstruction with a selected method, this button plots the tree on a map. The movement of states can be animated, or tracked with a scroll bar. Note: This step requires that a correct country format is selected for the csv.

TreeLite Manual
Use
TreeLite is a simple phylogenetic tree visualization tool intended for the most basic and common operations. It takes as an input a newick or nexus format tree, that can be later navigated by zooming and panning with a mouse. Additional functions include the ability to re-root the tree by clicking a branch (and pressing the "Reroot" button) and to search for a specific name or set of characters in the leafs.
TreeMin Manual
Treemin creates a minimized representation of the tree, based on subtrees reconstructed from the attributes of the leafs. This results in a summarized version of the tree that can be more easily explored. The collapsed subtrees will form bigger nodes (size depends on leaf counts of the subtree) that can be clicked and then seen on another panel.
Data input
The online version of Treemin takes as an input a Newick format tree and a Csv containing an identifier and the fields that will be used to collapse and minify the tree.

Example files to load for the tool can be found here:
Set 1:
Example tree 1
Example csv 1
Set 2:
Example tree 2
Example csv 2
It is recommended to select short names (1-20 characters) for leaf identifiers and avoid the use of special characters to avoid any parsing errors. In case the tool cannot display a tree it is best to shorten the name of the identifier and/or remove any special charaters of the leaf.
Functions
Treemin will automatically collapse the tree based on the input field in the integration process. The minification is performed by using a backward single pass algorithm (similar to parsimony) that collapses all nodes with children of the same state. It tranverses the tree from back to front assigning the states of the parent nodes based on the state of the children nodes, then it collapses all the subtrees that have children with a unique state.
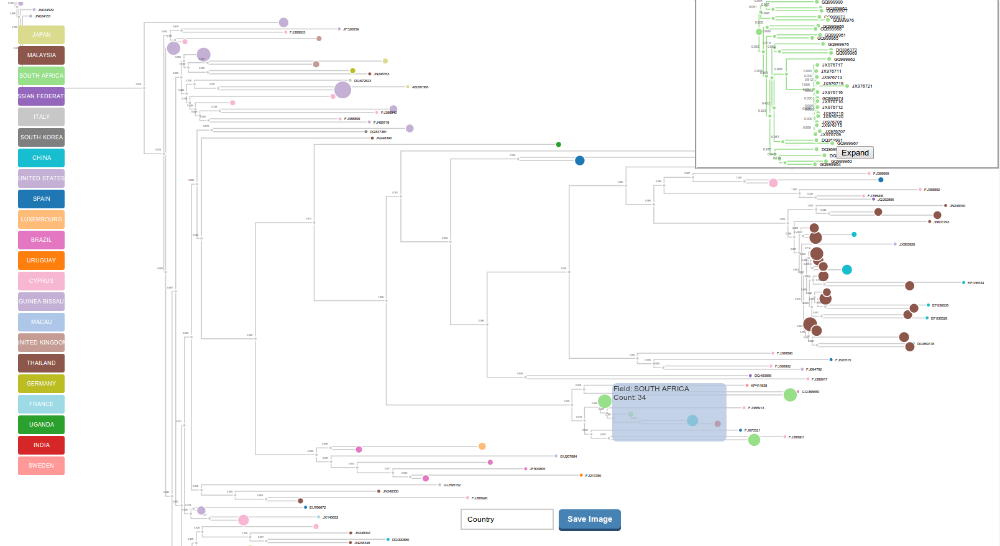
The subtrees can be displayed on the right panel by clicking over a collapsed cluster, it can also be opened in a different window and downloaded. The Minified tree visualization can be downloaded as an svg image along with the labels that were created. There is an additional option to collapse the phylogenetic tree by additional fields that were selected in the integration step, they will be accesible in the dropdown list at the bottom of the tool.
Website Installation Manual
Installation
For the installation of Treelink and their components first visit the Github repository and download the necessary installation files and their libraries. Then upload those files to your server.
Loading Visualizations
In order to load a visualization first it is necessary to add a <div id="tree-container"> inside the body of your html file.
Javascript functions: To load the visualization on the html file add the following functions to the webpage javascript code.
PhyloDisplay(NEWICKpath,CSVpath,FASTApath) will load the Treelink main visualization.
Clustree(NEWICKpath,Cut,CSVpath,FASTApath) will load the Clustering visualization.
Phylogen(NEWICKpath,Cut,1,CSVpath) will load the min graph visualization.
makemap(NEWICKpath,CSVpath) will load the Treemap visualization.
NEWICKpath refers to the location of the newick file, CSVpath to the location of the csv and FASTApath to the fasta file. Cut is the cutting value for the tree.